The White Coat · Critical Care & Hemodynamics
The Swan-Ganz Catheter: A Practical Guide for Residents
Educational material for healthcare trainees and clinicians; not individualized medical advice.
On this page
What is a Swan-Ganz catheter?
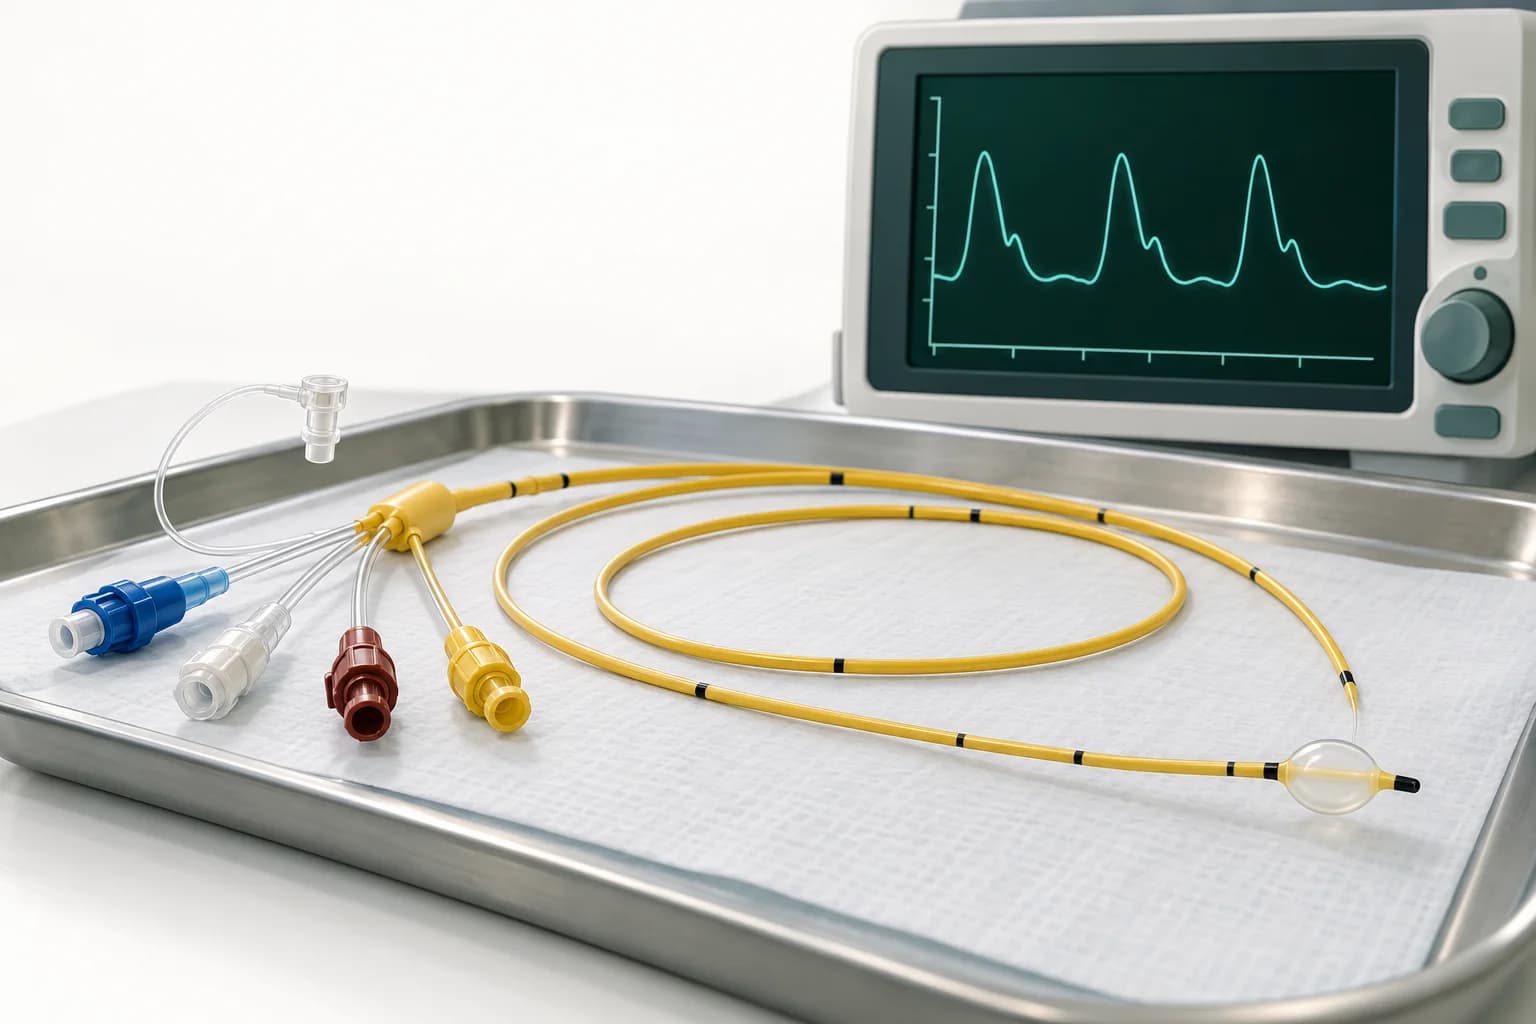
A Swan-Ganz catheter is a pulmonary artery catheter (PAC) used to measure right-heart and pulmonary artery pressures, estimate left atrial pressure with PAWP/PCWP, and assess cardiac output and mixed venous oxygen saturation (SvO₂).
The Swan-Ganz catheter, also called a pulmonary artery catheter (PAC), has a way of turning into six numbers on a monitor that nobody quite knows what to do with. You inherit a patient in the CCU or MICU, the nurse asks whether you want to give a liter, and suddenly you’re trying to remember a pressure-volume lecture from MS2.
This is meant to be a practical guide for that moment. The goal is not to reproduce a hemodynamics textbook. It is to understand what the Swan measures, how to make sure the measurements are real, how to put the numbers together, and how those numbers can actually change what you do.
One principle runs through all of it:
A PAC is a diagnostic tool, not a treatment.
It only helps if the measurement is accurate, the physiology is interpreted correctly, and the information changes management.
Swan-Ganz normal values
These are the numbers worth knowing or having readily available at the bedside.
| Parameter | Typical resting value | What it mainly tells you |
|---|---|---|
| RAP/CVP | ~2–8 mmHg | Right-sided filling pressure |
| RV | ~15–30 / 2–8 mmHg | RV systolic and diastolic pressure |
| PA | ~15–30 / 4–12 mmHg | Pulmonary artery pressure |
| mPAP | ≤20 mmHg | >20 mmHg meets the current PH threshold |
| PAWP/PCWP | Usually ~6–12 mmHg | Estimates left atrial pressure |
| CO | ~4–8 L/min | Absolute systemic blood flow |
| CI | ~2.5–4.0 L/min/m² | Cardiac output indexed to body size |
| SVR | ~800–1,200 dyn·s/cm⁵ | Systemic vascular tone |
| PVR | <2 WU | Pulmonary vascular resistance |
| SvO₂ | ~65–80% | Balance between systemic oxygen delivery and consumption |
A few thresholds come up repeatedly. A cardiac index <2.2 L/min/m² is commonly used as part of the hemodynamic definition of cardiogenic shock. A PAWP >15 mmHg generally indicates elevated left-sided filling pressure in hemodynamic classifications. Current pulmonary hypertension definitions use PVR >2 Wood units as abnormal.
Do not treat these as independent diagnostic tests. The Swan becomes useful when the numbers are interpreted together.
Does a Swan-Ganz catheter improve outcomes?
For routine ICU use, the answer is largely no.
The major randomized trials did not show a survival advantage from routinely placing pulmonary artery catheters in unselected critically ill patients. PAC-Man found no mortality benefit in general ICU patients. FACTT found that PAC-guided management in acute lung injury did not improve survival or organ function compared with central venous catheter-guided management and produced more catheter-related complications. ESCAPE, which studied advanced decompensated heart failure without frank cardiogenic shock, found no improvement in days alive outside the hospital.
That history is important because it prevents a common overcorrection: a Swan itself does not improve outcomes.
Cardiogenic shock is a different question
The major negative PAC trials were not trials of modern cardiogenic-shock care.
More recent observational studies have produced increasingly favorable, although not uniform, signals. The association appears strongest in heart-failure-related cardiogenic shock, while the evidence in acute MI-related shock has been less consistent.
In the Cardiogenic Shock Working Group registry of 1,055 patients with HF-related cardiogenic shock, 834 patients—about 79%—received a PAC. PAC use was associated with lower in-hospital mortality, with an adjusted odds ratio of 0.68. Placement within six hours was associated with an odds ratio of 0.54 compared with delayed placement at 48 hours or later or no PAC placement.
A 2026 meta-analysis of 14 observational studies similarly found PAC use associated with lower mortality, with a pooled odds ratio around 0.70. But the studies were highly heterogeneous, and PAC use was also associated with substantially more mechanical circulatory support and more sepsis. A separate 2023 meta-analysis did not find a significant overall mortality benefit and found no clear benefit in ACS-related cardiogenic shock.
So the appropriate conclusion is not that PACs save lives. These are observational associations that are vulnerable to selection bias, center effects, shock-team structure, differences in MCS use, and the fact that centers placing Swans aggressively may simply manage shock differently.
Current guidance reflects that uncertainty. The 2022 AHA/ACC/HFSA heart failure guideline states that PA-line placement may be considered in cardiogenic shock. The SCAI cardiogenic-shock consensus supports invasive hemodynamics for diagnosis and management, and the 2025 ACC cardiogenic-shock guidance emphasizes the value of invasive hemodynamics for defining the shock phenotype, assessing severity, and guiding temporary MCS escalation and weaning.
The ongoing randomized PACCS trial should help, but it will not answer every question. PACCS is studying about 400 patients with cardiogenic shock from acutely decompensated systolic heart failure. It excludes AMI, sepsis, primary RV failure, pulmonary embolism, and tamponade. A positive or negative result will therefore be highly relevant to HF-related shock without settling PAC use across every cardiogenic-shock phenotype.
The practical takeaway is simple:
Don’t put a Swan in everyone. Use it when the hemodynamic answer is likely to change management.
That is especially true when the shock phenotype is uncertain, RV or biventricular failure is suspected, vasodilatory and cardiogenic physiology may coexist, the patient is not responding as expected, or you are deciding whether to escalate or wean mechanical circulatory support.
What does a Swan-Ganz catheter measure?
The main Swan-Ganz catheter measurements include RAP/CVP, RV and pulmonary artery pressures, PAWP/PCWP, cardiac output, and SvO₂. Cardiac index, SVR, PVR, PAPi, and cardiac power are calculated from measured inputs. The normal-values table above summarizes the usual resting ranges; the sections below explain how to interpret them together.
Swan-Ganz catheter placement
The catheter passes through the right atrium, right ventricle, and pulmonary artery. Its different lumens and sensors let you sample several parts of the circulation.
The catheter placement and waveform diagram shows how the pressure tracing changes at each position.
One safety point deserves to appear early: do not advance, withdraw, or reposition a PAC unless you are trained and permitted to do so locally. A resident should absolutely recognize a spontaneously wedged catheter or one that has fallen back into the RV. That does not mean the resident should independently manipulate it.
Swan-Ganz catheter ports
| Port | Location | Main use |
|---|---|---|
| Distal / PA | Catheter tip in PA | PA pressure, wedge tracing, mixed venous SvO₂ |
| Proximal / RA | Proximal catheter lumen in RA | RAP/CVP, infusions, thermodilution injectate |
| Balloon | At the tip | Temporary PA occlusion to obtain PAWP |
| Thermistor | Near the catheter tip | Thermodilution cardiac output |
The distal PA port should generally not be used for routine vasoactive infusions or fluid boluses. Continuous-oximetry catheters can estimate SvO₂ continuously, while continuous-cardiac-output catheters report a rolling value that can lag rapid hemodynamic changes.
How to measure Swan-Ganz pressures correctly
Most Swan errors happen before interpretation.
If the transducer is wrong, the wedge is wrong, or the waveform is wrong, the physiology you derive afterward is just very precise nonsense.
Start with the transducer. It should be leveled at the phlebostatic axis, approximately the fourth intercostal space at the mid-axillary line. Every centimeter of vertical error changes the measured pressure by roughly 0.74 mmHg. A transducer that is too low reads falsely high; one that is too high reads falsely low. Re-level after meaningful changes in patient position.
Pressures are generally measured at end-expiration, when intrathoracic pressure is closest to atmospheric pressure. During spontaneous breathing, inspiration lowers intrathoracic pressure and the tracing falls, so end-expiration is the higher portion of the tracing before inspiration. During positive-pressure ventilation, inspiration raises intrathoracic pressure and the tracing rises, so end-expiration is generally the lower portion before that rise.
End-expiration is not infallible. In severe obesity, COPD, vigorous spontaneous effort, or other situations with marked respiratory swings, end-expiratory intrathoracic pressure itself may be abnormal. When respiratory variation exceeds roughly 7–10 mmHg, it can be useful to document both the end-expiratory value and the respiratory-cycle average. Avoid asking patients to perform breath-holds simply to manufacture a prettier number.
And do not disconnect a sick patient from necessary PEEP to obtain a “better” wedge.
What does PCWP actually measure?
The pulmonary artery wedge pressure—also called PAWP or PCWP—primarily estimates left atrial pressure.
When there is no important mitral valve disease, pulmonary venous obstruction, or major left-atrial pathology, end-diastolic PAWP can also approximate LV end-diastolic pressure. But those two concepts should not be treated as synonymous.
In sinus rhythm, end-diastolic PAWP is generally measured using the mean of the a-wave, averaging its peak and trough. Avoid ectopic beats and the beats immediately after them.
In atrial fibrillation there is no a-wave. In that setting, measure the end-diastolic wedge approximately 130–160 ms after QRS onset, before the v-wave.
Large v-waves deserve attention. They can occur with significant mitral regurgitation or reduced left-atrial compliance and can make the mean PAWP substantially higher than the end-diastolic PAWP. The mean PAWP represents the average pressure transmitted back toward the pulmonary circulation and is generally the value used when calculating PVR.
Make sure it is actually a wedge
A true wedge tracing should lose the PA dicrotic notch, fall below the PA pressure, and take on an atrial-type waveform.
An overwedged tracing can progressively rise or become distorted and non-pulsatile. An incompletely occlusive wedge can read falsely high.
If the waveform is questionable—particularly when an unexpectedly high PAWP would change the diagnosis—confirm the wedge with a blood sample. After clearing approximately 5–10 mL from the distal lumen, a true wedge sample should have an oxygen saturation within roughly 3–5% of systemic arterial saturation. Values above about 90–95% are also commonly used as a practical check.
This is a troubleshooting maneuver, not something that needs to be done after every routine wedge.
High PEEP, hypovolemia, and catheter positioning outside West zone 3 can also disrupt the relationship between PAWP and true intracardiac filling pressure. There is no universally reliable correction such as “subtract half the PEEP.” Confirm the waveform, make sure the catheter is positioned appropriately, and correlate the number with echo and the rest of the hemodynamics.
When obtaining a wedge, inflate the balloon slowly and stop as soon as the tracing changes. Do not automatically inject the entire 1.5 mL. Keep inflation brief, allow the balloon to deflate passively, and confirm return of the PA waveform afterward.
If the catheter suddenly wedges with substantially less balloon volume than it required previously, suspect distal migration.
How to interpret a Swan: three questions
You do not need a giant grid of memorized patterns to interpret most Swans.
Ask three questions.
Is the patient congested? RAP tells you about right-sided filling pressure; PAWP tells you about left-sided filling pressure. If both are high, there is biventricular congestion. If RAP is disproportionately high relative to PAWP, think about RV-predominant disease.
Is forward flow adequate? Look at CI and cardiac power, but also SvO₂, MAP, lactate, urine output, mental status, and peripheral perfusion. There is no single number that defines adequate systemic perfusion.
What is driving the physiology? Is this predominantly LV failure, RV failure, increased pulmonary vascular load, vasodilation, hypovolemia, mechanical obstruction, or a mixture?
This is why trends matter so much.
A Swan is more useful as a movie than as a photograph.
If you change preload, afterload, inotropy, vasopressor support, or mechanical circulatory support, the important question is what happens afterward to RAP, PAWP, CI/CPO, SvO₂, and the actual patient.
Common Swan-Ganz shock profiles
| Profile | RAP | PAWP | CI | SVR | SvO₂ |
|---|---|---|---|---|---|
| LV-dominant cardiogenic | Normal/↑ | ↑ | ↓ | Usually ↑ | Usually ↓ |
| RV-dominant cardiogenic | ↑ | Normal/↓ | ↓ | Usually ↑ | Usually ↓ |
| Vasodilatory/septic | ↓/normal | ↓/normal | Normal/↑ early | ↓ | Normal/↑ |
| Hypovolemic | ↓ | ↓ | ↓ | ↑ | ↓ |
| Massive PE | ↑ | Normal/↓ | ↓ | ↑ | ↓ |
| Tamponade | ↑ | ↑/equalized | ↓ | ↑ | ↓ |
| Mixed cardiogenic + vasodilatory | Variable | Often ↑ | Often ↓ | Normal/↓ | Variable |
Real cardiogenic shock does not always look cold and wet. Patients can be cold and dry, warm and wet, predominantly RV shock, mixed cardiogenic/vasodilatory, or normotensive while remaining severely hypoperfused.
And the phenotype can change over hours.
Cardiac output: thermodilution vs Fick
Bolus thermodilution measures cardiac output by injecting a known volume of saline through the proximal RA port and measuring the downstream temperature change at the thermistor.
The practical technique matters. Obtain at least three technically sound measurements, ideally agreeing within roughly 10%. Injecting at approximately the same point in the respiratory cycle can improve reproducibility.
If your measurements are:
4.2, 4.1, and 6.8 L/min
do not average all three and report 5.0. The 6.8 is an obvious technical outlier. Repeat the measurement until you have three believable values.
Thermodilution becomes less reliable in several settings. Intracardiac shunts and extracorporeal circuits can distort the calculation. In very low-flow states, thermodilution may overestimate cardiac output because the injectate warms during prolonged transit; error can become substantial when CO falls below roughly 3–3.5 L/min.
The effect of significant tricuspid regurgitation is less straightforward. Contemporary AHA guidance considers thermodilution generally usable in TR, while other datasets suggest underestimation in moderate-to-severe TR. The practical answer is not that TR automatically invalidates thermodilution. If the number does not fit the rest of the patient, repeat it and compare it with an alternative method.
The Fick method
The Fick principle is:
The factor of 10 converts oxygen content from mL O₂/dL into mL O₂/L.
Direct Fick, in which VO₂ is actually measured, remains the reference standard. In routine practice, however, VO₂ is often assumed from predictive equations. Assumed Fick can be substantially inaccurate in critically ill patients whose metabolic rate differs from the population used to derive those equations.
When thermodilution and assumed Fick disagree substantially, do not simply choose the number you like better. Check the technique and understand why the methods may disagree.
Cardiac power output
Cardiac power incorporates both pressure and flow:
A CPO <0.6 W identifies a particularly high-risk cardiogenic-shock phenotype. It is a prognostic marker, not an automatic trigger for one specific intervention.
For example:
Some advanced-heart-failure literature separately reports an RAP-corrected cardiac-power calculation:
Treat that as a different metric rather than casually mixing the formulas.
PAPi and RV failure
The pulmonary artery pulsatility index is:
Lower values generally suggest worse RV function, but there is no universal PAPi cutoff.
A value around ≤0.9 has been described in AMI with RV involvement. Values <1.0 have been used in broader cardiogenic-shock populations. A cutoff of <1.85 has been associated with RV failure before LVAD implantation.
PAPi is generally most informative when RAP is meaningfully elevated—roughly >10 mmHg—and PASP is not markedly elevated, roughly <50 mmHg. If the pulmonary artery pressure is extremely high because the RV is facing enormous afterload, PAPi can look deceptively preserved.
The RAP/PAWP ratio is another clue to disproportionate right-sided failure, but its proposed thresholds are similarly population-specific.
These are supportive physiologic indices. They are not binary tests for RV failure.
SvO₂ and oxygen delivery
Mixed venous oxygen saturation reflects the balance between systemic oxygen delivery and oxygen consumption.
The relevant equations are:
and:
When using the equation, enter SaO₂ as a fraction—for example, 0.98 rather than 98.
SvO₂ therefore depends on cardiac output, hemoglobin, arterial oxygen saturation, metabolic demand, and tissue oxygen extraction.
A falling SvO₂ may reflect falling cardiac output, but anemia, hypoxemia, fever, shivering, agitation, pain, or increased work of breathing can do the same thing.
Conversely, a normal or high SvO₂ does not guarantee adequate perfusion. In septic shock, impaired peripheral oxygen extraction can produce a surprisingly high SvO₂ despite severe illness.
SvO₂ is an oxygen supply-demand measurement, not a cardiac-output monitor.
Swan-Ganz waveforms
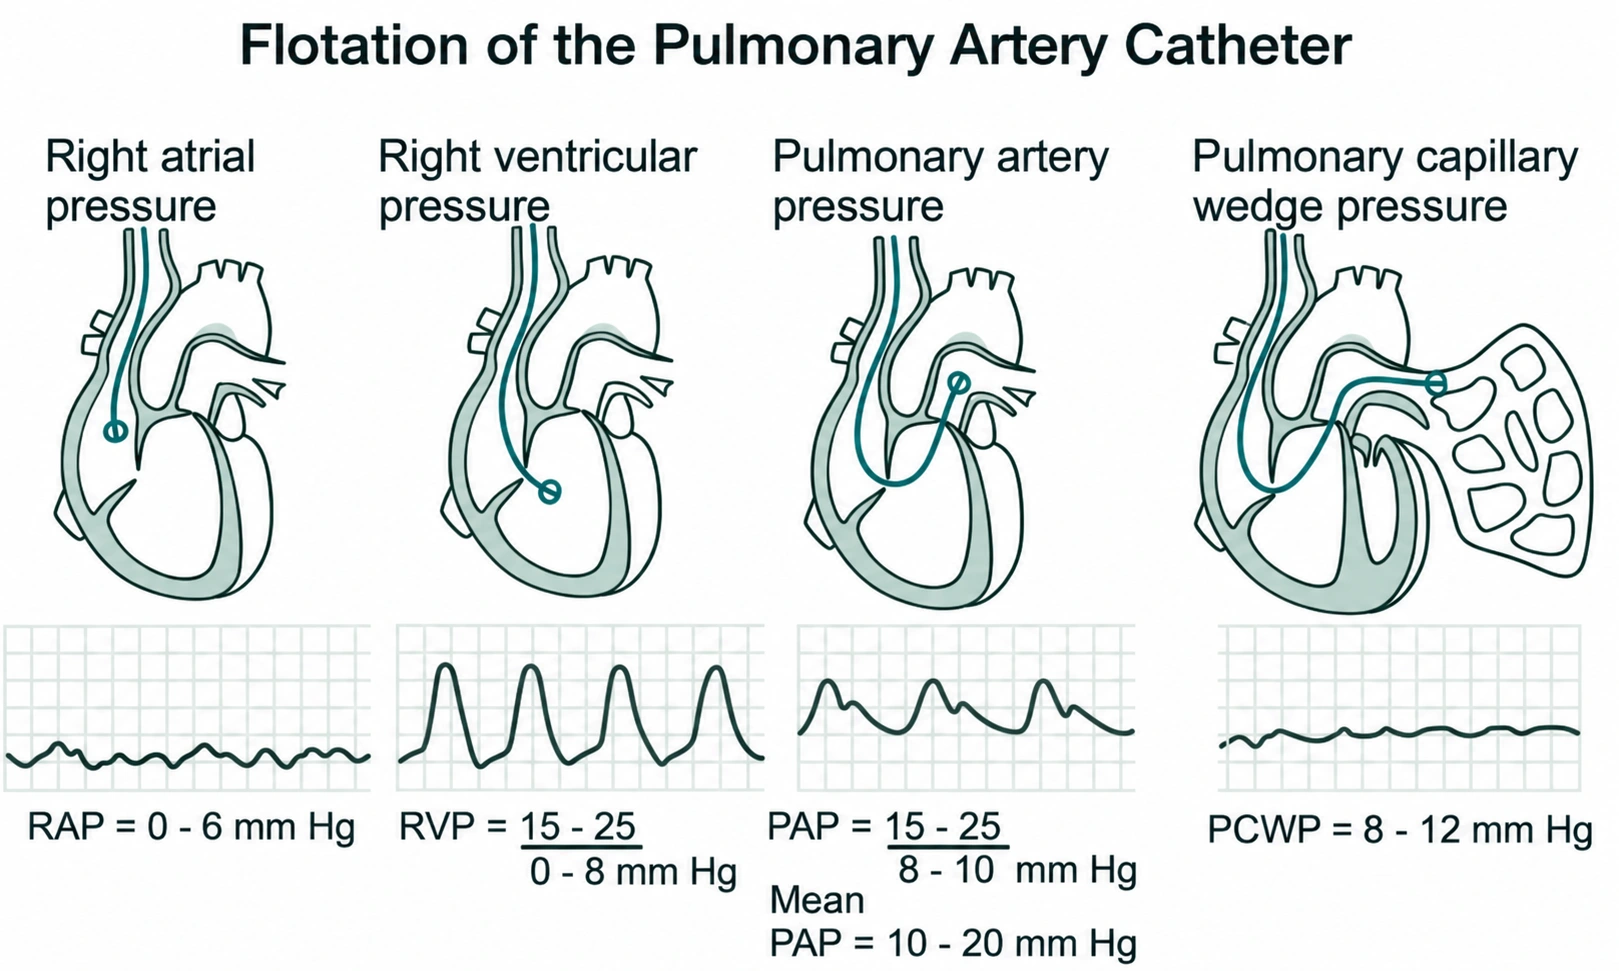
The waveform changes predictably as the catheter moves through the right heart.
| Position | Typical pressure | What changes |
|---|---|---|
| RA | Mean ~2–8 | Low-pressure atrial waveform |
| RV | ~15–30 / 2–8 | Systolic pressure jumps while diastolic remains low |
| PA | ~15–30 / 4–12 | Diastolic pressure rises and a dicrotic notch appears |
| Wedge | Usually ~6–12 | Lower-pressure atrial-type waveform |
The RA waveform contains an a-wave from atrial contraction, a c-wave associated with tricuspid closure, an x descent from atrial relaxation and downward movement of the tricuspid annulus, a v-wave from atrial filling during ventricular systole, and a y descent as the tricuspid valve opens and the RV fills.
In tamponade, the classic RA tracing shows elevated pressure with a prominent x descent and a blunted or absent y descent.
In constrictive pericarditis, both the x and y descents are typically prominent, and ventricular pressure tracing may show dip-and-plateau physiology.
These patterns are supportive rather than diagnostic. A prominent y descent can also occur in restrictive cardiomyopathy, and equalization of diastolic pressures is not specific to tamponade.
If RAP, RV diastolic pressure, PADP, and PAWP unexpectedly cluster together, think about tamponade, constriction, and severe RV failure, and correlate urgently with echo and the clinical picture.
Using Swan data to guide treatment
The PAC tells you the physiology.
It does not choose the treatment for you.
A CI below 2.2 does not automatically mean “start dobutamine,” just as a low RAP does not automatically mean “give a liter.”
First determine whether the patient is actually hypoperfused and why.
This is particularly important in RV failure. “RV failure means give fluid” is wrong. “RV failure means never give fluid” is also wrong. A truly preload-depleted patient with acute RV infarction may improve with cautious volume. A patient with RAP 18, low cardiac output, and a low PAPi is telling you something very different: the RV is already struggling at a high filling pressure, and another empiric liter may worsen RV dilation, septal shift, TR, and systemic venous congestion.
Vasoactive therapy in cardiogenic shock
The evidence gives useful guardrails without producing a single universal vasopressor algorithm.
In SOAP II, dopamine caused more arrhythmias than norepinephrine overall. The cardiogenic-shock subgroup, which included about 280 patients, also showed a mortality signal favoring norepinephrine, although that subgroup was not powered as a definitive mortality comparison.
Norepinephrine is therefore generally favored over dopamine when vasopressor support is required, although major guidelines do not all designate one mandatory first-line agent for every cardiogenic-shock phenotype.
In the 57-patient OptimaCC trial of AMI-related cardiogenic shock, epinephrine and norepinephrine produced similar changes in cardiac index, the primary efficacy endpoint. However, refractory shock occurred substantially more often with epinephrine—37% versus 7%—and the trial was stopped early.
For inotropes, DOREMI found no significant difference between milrinone and dobutamine in its primary composite outcome or mortality. The choice is usually physiologic. Milrinone is an inodilator, is renally cleared, and has a longer half-life. Dobutamine is easier to titrate rapidly but can produce tachycardia and arrhythmias. Neither has demonstrated a survival advantage.
The important habit is to avoid treating the CI in isolation. Ask about MAP, cardiac power, filling pressures, perfusion, RV function, the cause of shock, and whether escalating catecholamines is actually helping or merely delaying mechanical support.
ARDS vs cardiogenic pulmonary edema
Do not use PCWP alone to diagnose or exclude ARDS.
The Berlin definition removed the old PAWP ≤18 mmHg requirement because ARDS and elevated hydrostatic filling pressures can coexist. Modern definitions instead ask whether the respiratory failure is fully explained by cardiac failure or fluid overload.
If a Swan is already present, a low PAWP argues against purely hydrostatic pulmonary edema. An elevated PAWP does not exclude simultaneous ARDS.
FACTT also demonstrated that routinely placing a PAC to guide fluid management in acute lung injury did not improve outcomes.
Pulmonary hypertension: the hemodynamic definitions
| Type | mPAP | PAWP | PVR |
|---|---|---|---|
| Pre-capillary PH | >20 | ≤15 | >2 WU |
| Isolated post-capillary PH | >20 | >15 | ≤2 WU |
| Combined pre/post-capillary PH | >20 | >15 | >2 WU |
Acute vasoreactivity testing is intended specifically for idiopathic, heritable, or drug-associated PAH, not every patient with pre-capillary pulmonary hypertension.
A positive response requires a fall in mPAP of at least 10 mmHg to an absolute mPAP ≤40 mmHg, with unchanged or increased cardiac output.
Accepted agents include inhaled nitric oxide, inhaled iloprost, and IV epoprostenol. IV adenosine is no longer recommended.
Troubleshooting a Swan overnight
A normal PA waveform should continuously appear on the distal port.
If it suddenly becomes a wedge waveform while the balloon is down, assume distal migration and spontaneous wedging.
Do not flush the distal lumen.
Stop using it in a way that could cause PA injury and get someone experienced with PAC repositioning involved.
If the distal tracing instead becomes an RV waveform, the catheter has fallen back into the right ventricle. This increases the risk of ventricular ectopy and VT and requires appropriate repositioning.
Also pay attention to how much balloon volume is required to wedge. A catheter that suddenly wedges with much less volume than before may have migrated distally.
Before reacting to any strange Swan number overnight, check the simplest explanations first. Is the transducer leveled? Does the waveform look right? Was the pressure measured at the correct respiratory phase? Does the cardiac output fit with SvO₂, lactate, urine output, MAP, and the patient in front of you?
And every day ask whether the PAC still needs to be there.
There is no universal 72–96-hour rule requiring PAC replacement or removal. Catheter colonization becomes more common after approximately four days and bloodstream-infection risk becomes more apparent after about five to seven days, but scheduled PAC replacement has not been shown to reduce bloodstream infection.
Use a sterile protective sleeve over the catheter, and remember that the introducer itself is also a potential infection source and may colonize before the PAC.
The bedside rule is simpler:
Remove the PAC when its information is no longer changing management.
PAC complications residents need to recognize
Most PAC complications are uncommon, but a few are important enough that you need to recognize them immediately.
| Complication | What you may see | What matters immediately |
|---|---|---|
| PA rupture | Bright-red hemoptysis, often after wedging | Emergency airway/ICU help, bleeding side down if known, stop manipulation, reverse anticoagulation when appropriate, involve IR/thoracic surgery |
| Pulmonary infarction | Peripheral infiltrate, pleuritic pain | Stop prolonged/spontaneous wedging and reassess position |
| Ventricular ectopy/VT | Often during RV passage or migration | Stop provoking manipulation; sustained VT/VF gets standard ACLS |
| Heart block | Particularly concerning with baseline LBBB | Continuous monitoring and access to pacing |
| Pneumothorax/arterial injury | Usually related to central access | Diagnose and treat appropriately |
| CLABSI | Fever, bacteremia, insertion-site findings | Cultures, treatment when indicated, remove unnecessary/infected hardware |
| Balloon rupture | Blood in balloon lumen or failure to inflate | Stop using balloon and arrange removal/exchange |
| Knotting | Resistance during withdrawal | Stop pulling. Obtain imaging and procedural help |
Pulmonary artery rupture is rare—on the order of approximately 0.03% in older large series—but potentially catastrophic. Pulmonary hypertension, anticoagulation, advanced age, distal catheter position, and repeated or prolonged balloon inflation increase the risk.
Bright-red hemoptysis immediately after a wedge measurement is PA injury until proven otherwise.
Call for immediate airway and critical-care help, put the suspected bleeding lung down when laterality is known, stop further balloon inflation and unnecessary catheter manipulation, reverse anticoagulation when appropriate, and involve interventional radiology early. Endovascular embolization is commonly preferred when anatomically feasible, with surgery reserved for selected cases or failed endovascular management.
Also remember that PA injury does not always present immediately. Delayed hemoptysis can reflect a catheter-related pulmonary artery pseudoaneurysm.
Practice cases
Cold and wet
RAP 12, PCWP 22, CO 3.5 L/min, CI 1.8 L/min/m², MAP 62, SVR approximately 1,140, and SvO₂ 50%.
Cardiac power is:
62 × 3.5 / 451 ≈ 0.48 W
This is a low-flow, congested cardiogenic-shock phenotype with low cardiac power.
The next step is not simply “CI 1.8, start dobutamine.” Determine the cause, assess perfusion pressure, treat congestion when appropriate, use vasopressor or inotropic support according to the actual physiology, and involve the shock team early if the patient is not improving or MCS may be required.
The failing RV
RAP 18, PAWP 8, CO 3.0, PASP 30, PADP 18.
RAP/PAWP:
PAPi:
(30 − 18) / 18 ≈ 0.67
Approximate mPAP is about 22 mmHg, giving a PVR of:
(22 − 8) / 3 ≈ 4.7 WU
This is not merely “RV failure with a low PAPi.” The RV is failing while facing a substantial pulmonary vascular load.
That should trigger a search for the cause: pulmonary embolism, hypoxic pulmonary vasoconstriction, ARDS, pulmonary vascular disease, or another process increasing RV afterload.
RAP 18 strongly argues against another blind fluid bolus.
Equalized pressures
RAP, RV diastolic pressure, PADP, and PAWP all cluster around 16 mmHg.
Think tamponade, constriction, and severe RV failure.
An RA tracing with a prominent x descent and blunted y supports tamponade. Prominent x and y descents support constrictive physiology. Neither pattern is perfectly specific.
Get an urgent echo rather than diagnosing tamponade from equalized numbers alone.
Which wedge is correct?
A spontaneously breathing patient has a PAWP of 9 at the inspiratory trough and 14 at end-expiration.
Under ordinary circumstances, record approximately 14 mmHg.
The respiratory swing is 5 mmHg, which is not large enough by itself to abandon the conventional end-expiratory measurement.
If the patient instead had swings greater than roughly 7–10 mmHg because of severe obesity, COPD, or vigorous respiratory effort, consider documenting both the end-expiratory and respiratory-averaged values.
The weird wedge
A ventilated patient on PEEP 14 has an unexpectedly high PAWP with a flat, abnormal tracing.
Do not believe the number yet.
Think overwedging, incomplete occlusion, distal catheter migration, non-zone-3 positioning, or high alveolar pressure. Deflate the balloon, make sure the PA waveform returns, reassess technique and catheter position, and consider wedge saturation and echo.
Do not disconnect the patient from needed PEEP just to obtain a prettier number.
Falling SvO₂
SvO₂ falls from 68% to 52% over two hours while hemoglobin and SaO₂ are unchanged.
Falling cardiac output is an important possibility, but not the only one.
Recheck cardiac output and examine the patient. Fever, shivering, agitation, pain, and increased work of breathing all increase oxygen consumption and can lower SvO₂.
Bright-red blood after wedging
A patient develops sudden bright-red hemoptysis immediately after a wedge measurement.
Treat this as pulmonary artery injury until proven otherwise.
Call for airway and critical-care help, place the bleeding lung down when laterality is known, stop further balloon inflation and unnecessary catheter manipulation, reverse anticoagulation when appropriate, and involve interventional radiology and/or thoracic surgery urgently.
The 30-second Swan interpretation
Suppose someone gives you:
RAP 16 / PA 48/26 / PAWP 24 / CI 1.7 / MAP 88 / SVR ~1,700 / SvO₂ 48%.
Assuming a BSA of about 2.0 m², CO is approximately 3.4 L/min.
The right and left filling pressures are elevated, so the patient is congested. CI and SvO₂ are low, so forward flow is inadequate. SVR is high, meaning the circulation is vasoconstricted rather than vasoplegic.
And notice the MAP: 88 mmHg.
This is an important reminder that cardiogenic shock does not require hypotension. A patient can maintain an apparently reassuring blood pressure through intense vasoconstriction while forward flow and tissue perfusion remain poor.
You could calculate more numbers. Approximate mPAP is 33 mmHg and PVR is around 2.7 WU. PAPi is approximately 1.38. RAP/PAWP is approximately 0.67.
But that is not the main point.
The useful bedside summary is:
This is a congested, low-flow, high-SVR cardiogenic-shock phenotype despite a preserved MAP.
Then ask why.
Acute MI? Acute-on-chronic HF? Mechanical complication? Arrhythmia? Valvular catastrophe? RV dysfunction?
That is the point of the Swan.
Not to produce more numbers.
To tell you what the circulation is doing—and whether what you’re doing is making it better.
Quick questions residents commonly ask
What are normal Swan-Ganz numbers?
RAP is roughly 2–8 mmHg, PA pressure approximately 15–30/4–12 mmHg, resting PAWP usually around 6–12 mmHg, cardiac index approximately 2.5–4.0 L/min/m², PVR <2 WU, and SvO₂ roughly 65–80%.
What does a high PCWP mean?
A high PAWP generally reflects elevated left-atrial pressure and therefore left-sided congestion. Mitral valve disease, altered LA compliance, positive-pressure ventilation, catheter position, and measurement technique can all modify that relationship.
What is a normal cardiac index?
Approximately 2.5–4.0 L/min/m². A CI below 2.2 is commonly used as one component of cardiogenic-shock hemodynamics, but it should never be interpreted without the rest of the perfusion profile.
How do you calculate PAPi?
PAPi = (PASP − PADP) / RAP. Lower values support worse RV function, but clinically useful cutoffs depend on the population.
What does SvO₂ tell you?
SvO₂ reflects the balance between systemic oxygen delivery and oxygen consumption. It depends on cardiac output, hemoglobin, arterial saturation, metabolic demand, and oxygen extraction.
Does a Swan-Ganz catheter reduce mortality?
Routine PAC use has not improved mortality in unselected ICU populations. In cardiogenic shock, especially HF-related shock, observational studies suggest better outcomes with PAC-guided management, but definitive randomized evidence is still lacking.
When should a Swan come out?
When the information it provides is no longer changing management. There is no universal 72–96-hour removal rule.
Selected references

Mendel Jacobs, MD, MPH
Menachem "Mendel" Jacobs, MD, MPH is an Internal Medicine Resident at Yale School of Medicine pursuing academic cardiology. He publishes under Menachem Jacobs.
Connect on LinkedIn